In the fast-paced world of fleet management, data is your secret weapon. Each vehicle in your fleet is a treasure trove of information, providing critical insights that can drive efficiency, slash costs, and turbocharge productivity.
But with so many potential metrics to monitor, where do you focus your attention?
Fear not, because we’re about to take a deep dive into the top fleet management metrics you should be tracking.
Prepare to unlock the true potential of your fleet by harnessing the power of data.
What are fleet management metrics?
Before we dive into the details, let’s explore what fleet management metrics are in the first place.
In short, fleet metrics are quantifiable measurements used to evaluate the performance, productivity, and efficiency of a fleet.
They empower fleet managers with the insights necessary to make informed decisions, enhance operations, minimize costs, improve safety, and optimize efficiency.
Now, let’s discuss the difference between fleet management metrics and fleet management KPIs (Key Performance Indicators).
How are fleet management metrics and KPIs different?
In a broad sense, all KPIs are metrics, but not all metrics are KPIs.
While ‘metrics’ is a broad term for any type of measurement, KPIs are a subset of metrics that are deemed as particularly important for tracking the success of strategic objectives.
Considering this, we can define both terms as:
Fleet Management Metrics: General measurements that monitor all aspects of a fleet’s performance. They can include anything from total fuel consumption, average idle times, total miles driven, number of late deliveries, and so on.
Fleet Management KPIs: Specific metrics that directly relate to the organization’s strategic objectives. These are the critical success factors for the fleet. For example, if a company’s strategic objective is to reduce operational cost, then ‘fuel cost per mile’ could be a KPI. If another objective is to improve safety, then ‘accident rate’ might be a KPI.
The fleet management metrics you need to know about
To make it easier to stay organized, we’ve split the essential fleet management metrics into two major categories – cost metrics and maintenance metrics.
Here’s what you need to know about each category in detail.
Cost metrics
Although there are numerous cost-related fleet management metrics leverage, the most important ones include:
- Maintenance Cost
- Maintenance Cost per Mile (CPM)
- Cost per Hour
- Total Vendor Expenses
- Cost per Equipment Categories
Maintenance Cost
The first fleet management metric that is essential to track is Maintenance Cost. It measures and represents the total cost of maintaining your fleet over a specific period of time.
This metric factors in costs for regular servicing, repairs, parts replacement, labor costs, and any other expenses directly related to maintaining the operational integrity of the vehicles.
It’s calculated by summing all the mentioned above expenses.

This data is important as it provides a straightforward measure of the financial resources spent on keeping your fleet in good shape. By having access to this data, you can better manage expenses and plan budgets.
Most importantly, you can identify patterns, inefficiencies, or specific vehicles that are more expensive to maintain. This knowledge can help you optimize your budget and plan for the future.
Maintenance Cost per Mile (CPM)
Next up, we have Maintenance Cost per Mile or CPM, another fundamental metric to assess.
It stands out from other fleet management metrics as an indicator of the cost of maintenance for every mile that a vehicle in the fleet travels.
To calculate CPM, simply divide the total maintenance cost by the total miles traveled by the fleet over a specific period.

What you’ll receive in the end is a useful measure for understanding the efficiency of your maintenance efforts.
Keep in mind that a lower CPM generally signifies more cost-effective maintenance. Monitoring this metric over time allows you to see the impact of your maintenance efforts and make adjustments as necessary.
Cost per Hour
When discussing fleet management metrics, it’s impossible to skip Cost per Hour. If you want to get an overall picture of the cost efficiency of fleet operations, you’ll need this piece of information.
Cost per Hour encompasses the total cost of operation per hour of vehicle usage. It includes maintenance costs, as well as other operating costs like fuel and insurance.
To calculate it, divide the total cost of operation by the total hours of vehicle usage.

By keeping track of this essential data, you can easily identify areas for potential cost savings, making your fleet more competitive in the end.
Total Vendor Expenses
No matter how big or small your fleet is, chances are that you partner with external repair shops for certain tasks and conduct vendor management.
Total Vendor Expenses is one of those fleet management metrics that helps you but a number behind your total vendor costs.
It refers to the total amount spent on outside vendors for things like parts, repairs, or services. It’s simply a sum of all vendor invoices over a certain time period.
Total Vendor Expenses = Sum of all vendor invoices
This metric is vital as it helps you track where your fleet’s money is being spent and allows you to evaluate whether you’re receiving good value from your vendors. It can help fleet managers negotiate better prices or detect the need to partner with new vendors.
Cost per Equipment Categories
Another metric related to the equipment category VMRS classification is Cost per Equiment Categories.
This metric breaks down maintenance cost by type or category of equipment. It’s calculated by allocating the maintenance costs to the specific equipment types.
This allows for a deeper analysis of costs, helping to identify which types of assets are more expensive to maintain and therefore might need to be replaced or better managed.
To calculate, allocate the maintenance costs to the specific equipment types.

This analysis can inform decisions on replacing or better managing specific types of equipment.
Maintenance metrics
At the same time, there are several maintenance fleet management metrics that you should also be familiar with:
- Downtime by Repair Class
- Preventive Maintenance Compliance Rate
- DVIR Defects
- Top 3 Categories Account For
- Top 3 Reasons For Repair Account For
Downtime by Repair Class
Let’s face it. One of the biggest fleet challenges of all time is downtime. And to prevent it, you’ll first need to understand it.
Downtime by Repair Class is a metric that tells you how long vehicles are out of action due to different types of repairs. It simply quantifies the amount of time your trucks spend in repair based on the class or type of repair.
The calculation involves tracking the time from when a vehicle enters maintenance until it’s fully functional again, for each type of repair.
Downtime by Repair Class = Total downtime for each repair class
This fleet management metric can help you identify which types of repairs cause the longest delays, allowing you to strategically target these areas for process improvement.
By understanding the reasons behind your fleet’s downtime, you can take steps to mitigate these issues, improving your fleet’s overall efficiency.
Read more: Vehicle downtime and how to reduce it?
Preventive Maintenance Compliance Rate
Preventive maintenance plays a crucial role in fleet management. It ensures that vehicles are repaired on time, before emergency, costly repairs knock on the door.
Although there are multiple ways to approach preventive maintenance, perhaps the most popular and efficient one is through PM intervals.
The Preventive Maintenance Compliance Rate metric utilizes a fleet maintenance software’s PM schedules and measures the percentage of preventive maintenance tasks that are completed on time.
You can calculate this fleet management metric using the following formula:
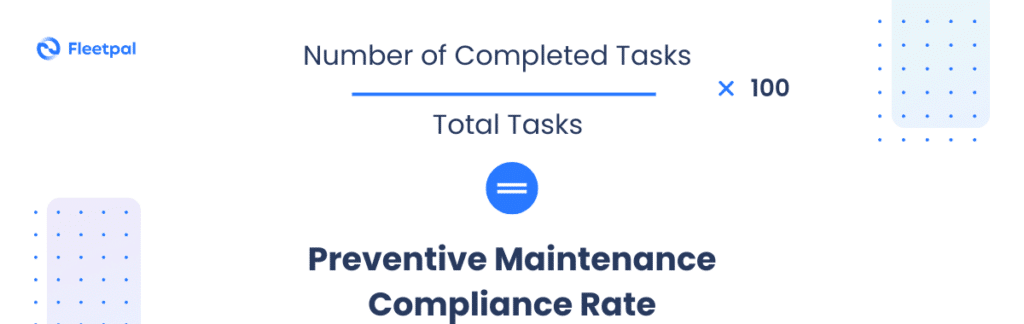
By taking advantage of this compliance rate, you can determine how well the preventive maintenance program of your fleet is being adhered to. High compliance rates typically lead to fewer breakdowns and lower maintenance costs.
DVIR Defects
DVIR stands for Driver Vehicle Inspection Report – a report that drivers are obliged to complete pre- and post-trip to ensure the vehicle is safe to operate.
DVIR Defects refers to the number of defects or issues identified in these reports. It’s important to track this metric as it provides insight into the general condition of the fleet and potential safety issues that need to be addressed.
The good news is that fleet maintenance software solutions like Fleetpal offer direct actionability on DVIR Defects. By creating digital work orders for every discovered defect, you can instantly begin solving problems before they turn into costly urgencies.
Top 3 Categories Account For
This metric typically refers to identifying the top three VMRS repair categories that account for most of the maintenance costs, downtime, and repairs. It, therefore, helps identify key areas for improvement.
It is calculated based on cost, time, or number of repairs attributed to each category.
Top 3 Categories = Sum of cost, time, or repairs per category
This metric can quickly expose the categories that require urgent attention. By focusing on these categories, you can make strategic decisions to optimize your maintenance efforts.
Top 3 Reasons for Repair Account For
Similar to the “Top 3 Categories Account For” metric, this metric identifies the top three reasons or causes for the majority of the fleet’s repairs.
This metric can help focus maintenance efforts on the most common problems, potentially reducing overall repair needs.
Top 3 Reasons for Repair = Frequency of each repair reason
By focusing on these reasons, you can potentially reduce the frequency and cost of repairs.
Why you should track fleet management metrics
For fleet managers and owners, fleet management metrics are important for several reasons:
- Performance tracking – Metrics help fleet managers monitor the performance of their fleet over time. This helps identify trends, reveal issues, and measure the impact of changes in policy or procedure.
- Decision-making – Metrics also provide essential data for informed decision-making. This can range from small, day-to-day operational decisions to larger, strategic choices like acquiring new vehicles or implementing new technologies.
- Reduced downtime – The ability to monitor essential fleet management metrics will ultimately reward you with the power to solve one of fleet maintenance’s key problems – downtime.
- Cost control – Many fleet management metrics, such as fuel efficiency or cost per mile, directly relate to the expenses of operating a fleet. Keeping track of these metrics can help pinpoint opportunities for cost savings
- Efficiency – Metrics related to vehicle utilization or driver productivity can reveal inefficiencies in how the fleet or drivers are being used.
How fleet management and maintenance software can help
Without a doubt, monitoring these fleet utilization metrics can be a daunting task without a dependable fleet management dashboard or digital tool.
That’s where Fleetpal steps in. We offer robust fleet maintenance software that comes with user-friendly data modules and sophisticated reporting functions.
Still wondering how to kick things off? Contact us and allow our team to guide you through the process while addressing all your queries.
