Fleet Management KPIs: A Complete Guide to Tracking Fleet Performance
Is your fleet running at peak performance, or is it idling in the slow lane?
Whether you're running a handful of semi-trucks or an armada of service vans, the secret to a profitable fleet lives in the numbers - and not just any numbers, but the fleet management KPIs that actually drive performance, cost control, and uptime.
In fleet management, what gets measured gets improved. This guide walks through the operational, cost, maintenance, inventory, and driver-safety KPIs every fleet manager should track - with the formula and the reason each one matters.
What Are Fleet Management KPIs?
Fleet management Key Performance Indicators (KPIs) are the metrics that tell you whether your operation is healthy. They turn the raw data your vehicles, telematics, and maintenance system generate every day into objective measures of efficiency, cost, reliability, and safety - the inputs you need to make decisions instead of guesses.
A well-chosen KPI set spans several areas of the business. The ones we cover below fall into five groups:
- Operational efficiency KPIs
- Cost KPIs
- Maintenance and reliability KPIs
- Parts and inventory KPIs
- Driver behavior and safety KPIs
See where your fleet is losing money
Fleetpal brings inspections, work orders, and PM schedules into one system — so downtime stops catching you off guard. Book a 20-minute walkthrough.
Schedule a demoFleet Management KPIs vs. Metrics
The terms get used interchangeably, but they aren't the same thing. All KPIs are metrics; not all metrics are KPIs.
Metrics are any quantifiable measurement of your operation - total fuel burned, miles driven, idle hours, number of late deliveries. They're the raw readings.
KPIs are the subset of those metrics tied directly to a strategic goal. If your objective is to cut operating cost, then cost per mile becomes a KPI. If it's safety, then accident rate is a KPI. In short, KPIs are the metrics that matter most to the outcomes you're chasing, and they're usually time-bound and measured against a target.
Why Fleet Management KPIs Matter
A disciplined KPI system pays off in a few concrete ways:
- Data-driven decisions - replace gut calls with evidence on cost, uptime, and risk.
- Performance monitoring - spot trends and problems before they hit the bottom line.
- Cost control - find where money leaks and where it's well spent.
- Benchmarking - set realistic targets and measure progress against them.
- Operational efficiency - surface idle assets, slow repairs, and underused capacity.
Tracking every metric below by hand is impractical, which is why most fleets lean on a fleet maintenance software platform to do it automatically. With that said, let's get into the KPIs.
Operational Efficiency KPIs
These KPIs measure how effectively your fleet is actually being used - the foundation everything else sits on.
Fleet Utilization
Fleet utilization shows how much of your fleet's capacity is working versus sitting idle. A high rate means assets are earning their keep; a low rate signals you can either tighten scheduling or shrink the fleet. It's commonly measured three ways:
- Time-based - the share of available time a vehicle is in use. A truck running 6 hours of a 24-hour day is at 25% time utilization.
- Distance-based - total miles covered against an expected baseline; well under baseline means the asset is underused.
- Load-based - for freight fleets, capacity used. A 20-ton truck regularly hauling 10 tons runs at 50% load utilization.
Utilization matters because unused vehicles are sunk cost - acquisition, insurance, licensing, and depreciation keep running whether the asset moves or not.
Cost per Mile
Cost per mile is the total operating cost of running your fleet divided by miles driven over the same period. It's one of the clearest read-outs of cost efficiency, and a sudden climb is an early warning that maintenance or fuel consumption is drifting.

The total operating cost rolls in fuel, maintenance, insurance, depreciation, and overhead. Track it over time and the trend line tells you whether your cost structure is improving or eroding.
Fuel Efficiency
Fuel efficiency is the average distance a vehicle travels per unit of fuel - miles per gallon (MPG) in the US. Because fuel is one of the largest line items in any fleet, small efficiency gains compound fast.

It's shaped by vehicle model, driver behavior, maintenance, route choice, and load. The usual levers are driver coaching, regular maintenance, route optimization, and replacing the worst offenders.
Idle Time
Idle time is the share of engine-on time when the vehicle isn't moving or doing work, calculated as idle hours divided by total engine hours. Excessive idling burns fuel and adds engine wear without producing a dime of value. Paired with telematics, it's one of the fastest KPIs to act on - and one of the quickest to show savings once drivers and routes are coached toward less idling.
Total Cost of Ownership (TCO)
Total cost of ownership captures everything a vehicle costs across its full lifecycle, not just its sticker price - acquisition, operating costs, depreciation, downtime, admin, and resale value, spread over the years or miles it serves.
TCO is what stops a "cheap" truck from quietly becoming your most expensive one. A low purchase price paired with high maintenance can easily beat a pricier but reliable unit on total cost, and only TCO surfaces that.
Cost KPIs
Where the efficiency KPIs tell you how hard your fleet works, these tell you exactly where the money goes. They're the backbone of any budget and the inputs to your fleet management ROI case.
Maintenance Cost
The total spent keeping your fleet running over a given period - servicing, repairs, parts, and labor, summed up.

On its own it's a budgeting number, but broken down by vehicle it exposes which assets are quietly draining the most - the first step toward fixing or retiring them.
Maintenance Cost per Mile (CPM)
Maintenance cost per mile isolates just the maintenance spend for every mile driven - total maintenance cost divided by total miles. Unlike the broader cost-per-mile above, CPM zeroes in on the shop, which makes it the cleanest gauge of whether your maintenance program is getting more or less efficient.

A falling CPM means your maintenance dollars are stretching further. A rising one usually points to an aging fleet or slipping preventive maintenance.
Cost per Hour
For fleets where hours matter more than miles - utility, construction, off-road - cost per hour divides total operating cost by total hours of vehicle use. It folds in maintenance plus fuel, insurance, and the rest, giving a single figure for the cost of putting an asset to work for an hour.

Total Vendor Expenses
Almost every fleet sends some work to outside shops. Total vendor expenses is simply the sum of all vendor invoices over a period. Tracking it shows where your outsourced dollars go and gives you the leverage to renegotiate rates or move work to better-value partners.
Cost per Equipment Category
This breaks maintenance cost down by asset type - tractors, trailers, pickups, and so on - by allocating spend to each category. Different equipment carries different cost profiles, and seeing them side by side tells you which classes are cheapest to run and which deserve a hard look at replacement or procurement.

Maintenance and Reliability KPIs
These KPIs measure how well you keep vehicles healthy and how predictable your operation is. Strong numbers here quietly improve almost every cost KPI above.
Preventive Maintenance Compliance
PM compliance is the percentage of scheduled preventive maintenance tasks completed on time - the single best read on maintenance discipline.
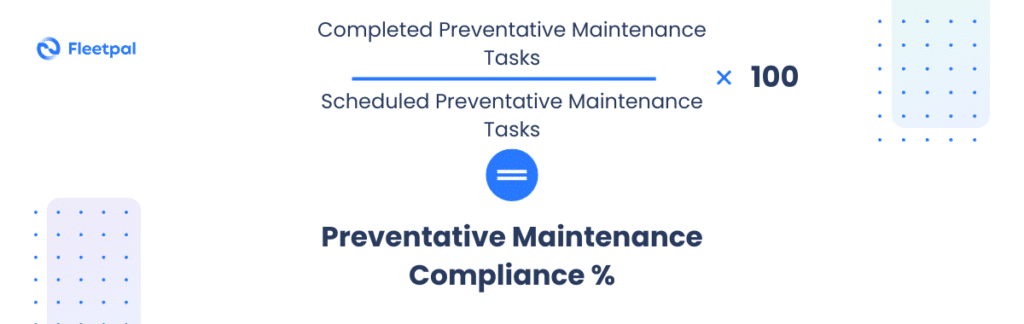
If you scheduled 100 PM services in a month and completed 95 on time, you're at 95%. High compliance keeps small issues from becoming roadside failures; poor compliance almost always resurfaces later as higher reactive repair cost and lost uptime.
Average Vehicle Downtime and Uptime
Downtime is the average time vehicles sit unavailable due to maintenance or repairs; uptime is its mirror - the share of time the asset is ready to work, calculated as (total time minus downtime) divided by total time.
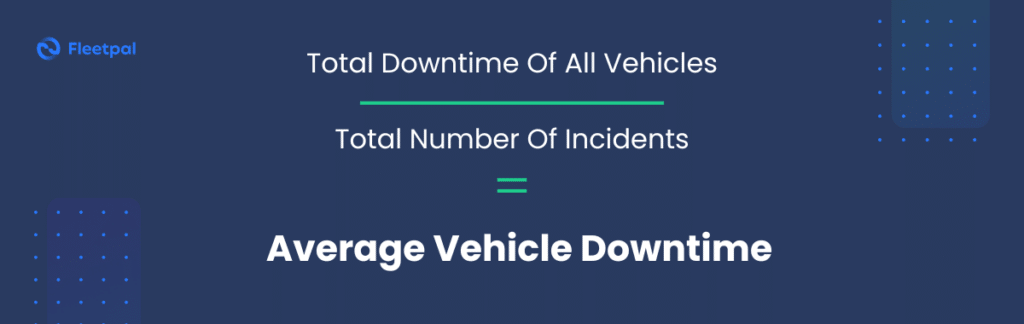
Every idle asset is lost revenue, so this is one of the most visible costs in the operation. Driving it down takes both a strong preventive program and fast repair turnaround.
Downtime by Repair Class
Total downtime is useful; knowing what causes it is better. Downtime by repair class tracks how long vehicles are out of service for each type of repair, so you can target the categories causing the longest delays for process improvement. For a deeper look, see our guide on vehicle downtime and how to reduce it.
Scheduled-to-Unscheduled Maintenance Ratio
This is the balance of planned work to unplanned breakdown repairs - scheduled events divided by unscheduled ones. A high ratio means you're in control and ahead of failures, which translates to less spend on emergency labor, towing, and expedited parts. It moves in lockstep with PM compliance: tighten one and the other follows.
Mean Time Between Failures (MTBF)
MTBF is the average distance or hours an asset runs between unplanned failures - total operating miles divided by number of failures. It's a direct measure of reliability, and tracking it by asset type quickly exposes aging equipment, underperforming models, and recurring system issues.
Repair Costs
Repair costs are the total spent returning vehicles to working order - parts, labor, and associated costs like towing or temporary replacements. Climbing repair costs usually signal one of three things:
- An aging fleet - older units need more frequent, costlier work.
- Lapsed maintenance - skipped preventive work lets small problems grow expensive.
- Driver behavior - aggressive driving accelerates wear.
Benchmark repair costs against past data, and when they outrun budget, it's your cue to tighten PM, coach drivers, or replace the worst assets.
DVIR Defects
A DVIR (Driver Vehicle Inspection Report) is the pre- and post-trip check drivers file to confirm a vehicle is safe to operate. DVIR defects counts the issues those reports surface - a live read on fleet condition and emerging safety problems. The payoff comes from acting on them: turning each defect into a digital work order means problems get fixed before they become roadside emergencies.
Top 3 Categories and Reasons for Repair
These two paired metrics identify the three repair categories and the three root causes that account for most of your cost, downtime, and repair volume. They cut through the noise fast: focus improvement effort on those few areas and you move the biggest numbers with the least effort.
Parts and Inventory KPIs
Parts Inventory: Valuation and Turnover
Your parts inventory is capital sitting on a shelf, and two KPIs keep it honest. Inventory valuation - quantity on hand multiplied by unit cost - tracks how much cash is tied up; overstocking traps money, understocking drives downtime.
Inventory turnover shows how often that stock is used and replaced, calculated as the cost of parts used divided by average inventory value.

A high turnover ratio means parts move efficiently; a low one points to obsolete stock or loose purchasing controls. Tools like just-in-time ordering and data-driven reorder points keep both numbers where they should be.
Driver Behavior and Safety KPIs
Finally, these KPIs measure the safety, efficiency, and effectiveness of the people behind the wheel.
Safety Incidents Rate
This quantifies how often safety events - accidents, violations, near misses - occur over a period, typically expressed per million miles driven so fleets of different sizes can be compared.
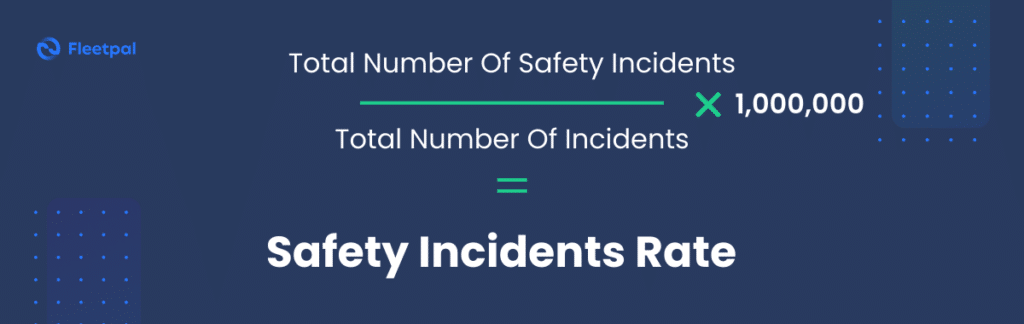
It speaks to driver safety, regulatory compliance, and the bottom line all at once. Investigate each incident for root cause, then act through safe-driving programs, preventive maintenance, and telematics-based monitoring.
Driver Productivity
Driver productivity measures how efficiently a driver completes their work - deliveries made, miles driven, or hours on the road per shift, depending on your operation. Higher productivity means more done in less time, which flows straight through to operational efficiency and profit.
Speeding, Acceleration, and Harsh Braking
Tracked through telematics, these behaviors hit safety, vehicle wear, and fuel economy at the same time. Surfacing and coaching them out reduces accidents, lowers maintenance and fuel costs, and protects your reputation.
Road Safety Compliance
This measures how well drivers and the fleet adhere to road safety law - speed limits, seatbelt use, hours-of-service rules, and impairment policies.

A high compliance rate signals discipline and limits legal exposure; a low one flags the need for training or corrective action before it becomes an incident.
Track Your Fleet KPIs with Fleetpal
Tracking this many KPIs by hand isn't realistic - the value only shows up when the numbers update themselves and sit in one place you can act on.
That's what Fleetpal does: powerful fleet maintenance software with clear data widgets and reporting that turn every KPI above into something you can see and improve. Want to put real numbers behind the savings first? Start with our fleet management ROI breakdown, then book a free demo and we'll walk your fleet through it.
The Fleetpal Team
Fleetpal builds maintenance and inspection software for commercial fleets. Our team works with fleet managers, technicians, and safety directors every day, turning shop-floor and roadside data into fewer breakdowns and lower cost per mile.
Ready to cut downtime and cost per mile?
Walk through a live setup with our team and see what your fleet's data has been trying to tell you.
Schedule a demoMore in Fleet Operations & Management

Tips On Creating a Fleet Numbering System
A good fleet numbering system makes every vehicle instantly identifiable. See how to design one, the formats that scale, and the mistakes to avoid.
Read article
Fleet Rightsizing: How To Calculate Fleet Size
How many vehicles does your fleet actually need? Learn the formula for right-sizing, the cost of getting it wrong, and the factors that drive it.
Read article
Fleet Asset Management: Everything You Need to Know
Read our in-depth guide on fleet asset management. Find out what the term means, why it's important for your fleet business, and more.
Read article
How To Calculate Vehicle Utilization Rate For Your Fleet
Vehicle utilization rate shows how hard each asset works. Learn the formula, what a healthy rate looks like, and how to fix underused vehicles.
Read article
What Is a Fleet Manager? Core Responsibilities And Tips For Improvement
A deep dive into one of the most essential roles in the logistics and transportation industry - fleet managers. Find out what is a fleet manager & more
Read article